Many people say that infographics are just going to be a fad. But nearly ten years after that prediction, I think it’s time to restate the rumor. In fact, rather than fading away, infographics have become a standard form of visual content.
I’m Asraf Masum, and I can’t wait to discuss the Leadership Infographics with you today!
You can use infographics to simplify a complex topic, visualize data, or summarize a piece of content. Almost anyone can create an infographic with Canva Editable Templates, but sometimes you need extra inspiration to get your creative juices flowing. I might as well round up some new and inspiring infographics.
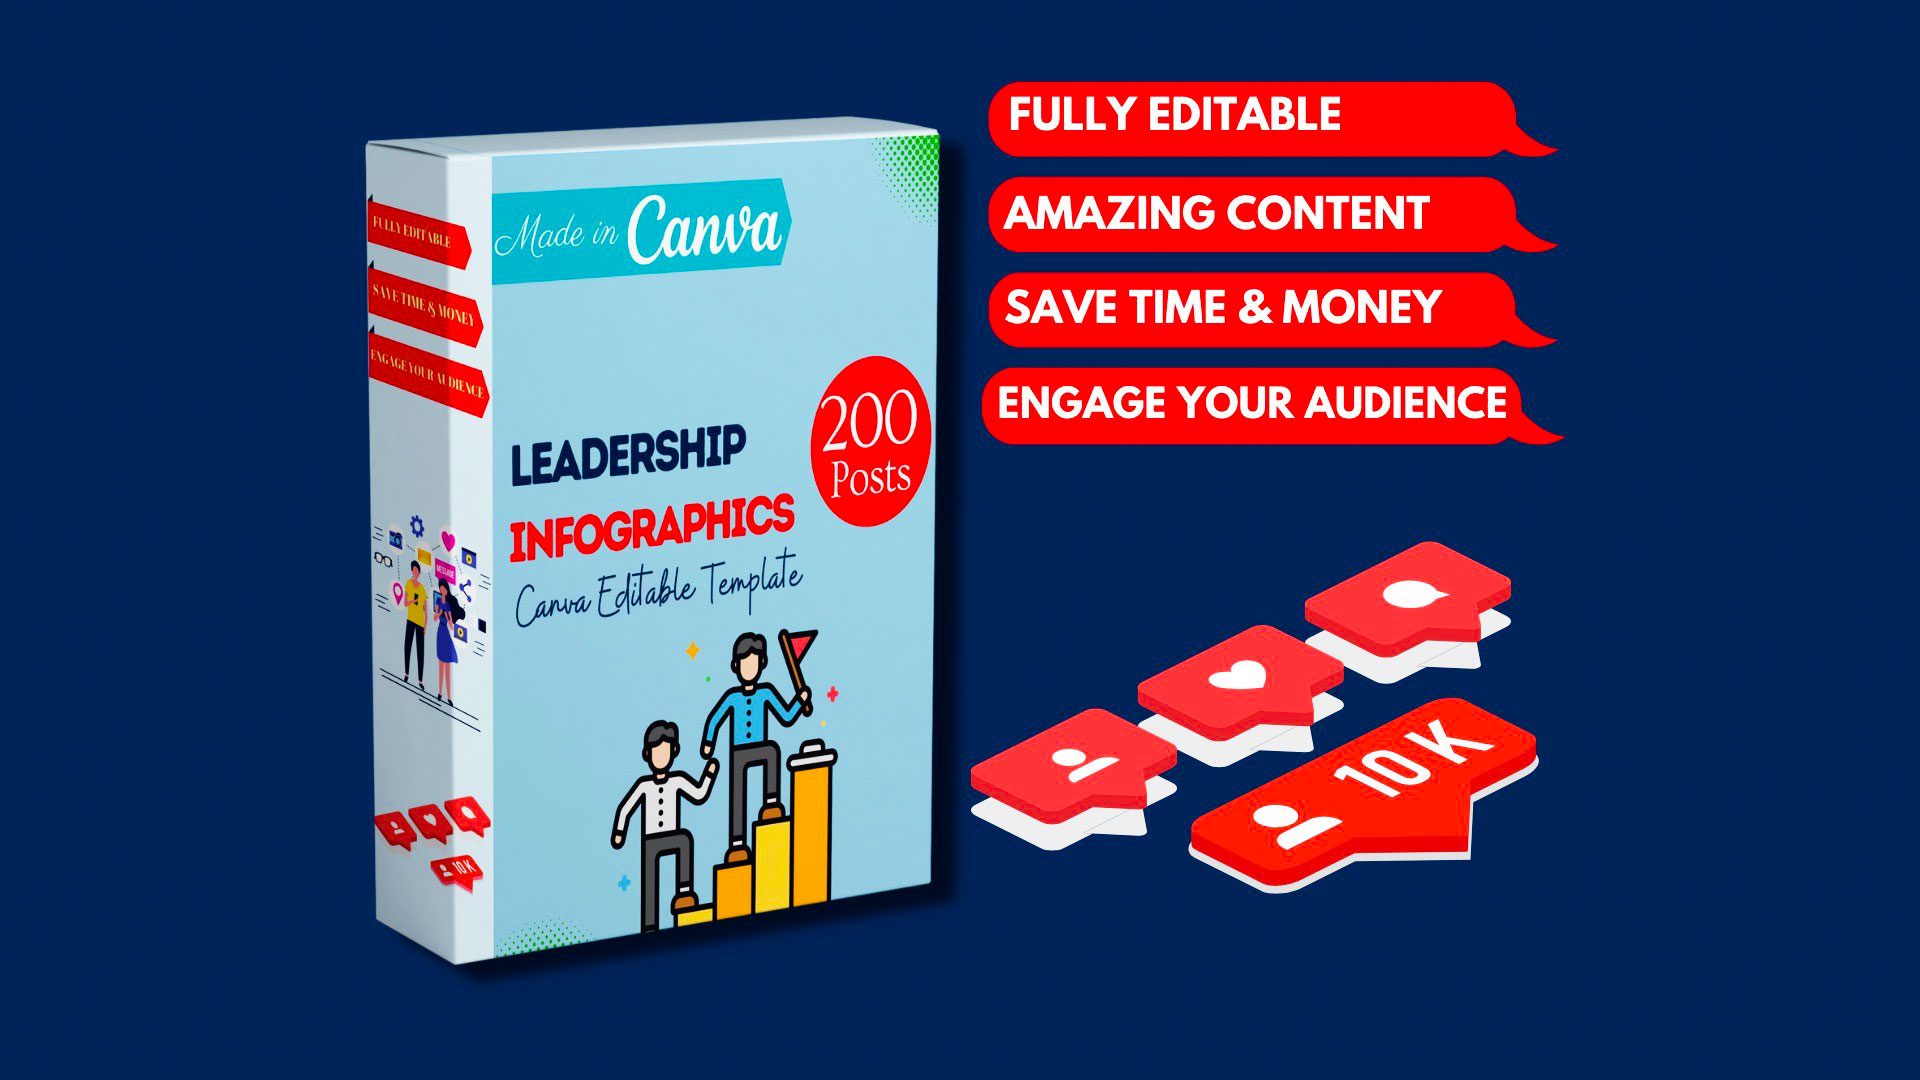
Hopefully, these leadership infographics will help you design a great infographic and also help you become a better leader this year. Add this infographics pack to reach your targeted audience and monetize your service.
Table of Contents
What are Leadership Infographics?
The term “infographic” is made up of the following two words: “information” and “graphic.”
An infographic is a collection of pictures, data visualizations like pie charts and bar graphs, and minimal text that summarises a subject. The best technique to engage users and interact with them without just using text or images is through leadership infographics. Canva offers a vast selection of themes and thousands of photos, so whatever your topic, you can bring it to life with the easy infographic creator.
What makes an infographic design effective?
When designing an engaging infographic – We must keep in mind that our brain searches for patterns in visual data to help us make sense of the environment.
We can use this concept to visually structure our information and create patterns that will enhance the message we are trying to communicate.
Let’s walk through some infographic design best practices to help you create beautiful, effective infographics.
Use lines, borders, and shapes to group information:
Even something as simple as the placement and grouping of elements on a page can affect how our readers perceive our graphics.
Visually organizing our content using essential design elements like borders, lines, circles, and squares will make it easier for our readers to interpret.
This technique of dividing the design into multiple sections makes the graphic easier to scan.
Use contrasting colors to guide your reader’s attention:
Another central design element to think about is color. We naturally gravitate toward using color to make infographics appealing, but color can also be a powerful communication tool.
Colors can be used to denote groups of information, just as lines and borders.
But more importantly, we can use color to draw attention to specific pieces of information and push supporting information into the background.
Please choose a color that contrasts with all other colors in the graphic and use it to highlight essential information.
Create a text sequence with three different font styles
When viewing an infographic, the typeface is usually one of the first things people notice. If poorly chosen, fonts can ruin an otherwise great infographic.
Using fonts correctly in infographics:
Our roundup of popular font types will point you in the right direction. The key to using fonts correctly in infographics is to create a transparent text hierarchy with three different font styles—one for primary headings, one for section headings, and one for body text.
The main header font should be the largest and can be the most stylized. Think of it as a way to set the mood of your infographic.
The font for section headings should be smaller and less stylized, but it should still stand out on the page.
Finally, body text fonts should be as small as possible and not stylized. It must be as simple to read as it is practical.
Make important takeaways remember by utilizing pictures, icons, and illustrations. Ensure your infographic focuses on visuals such as diagrams, symbols, icons, and data visualizations like charts and graphs.
Visuals are crucial to making your information engaging and memorable. The best infographics balance text and images equally.
The easiest way to ensure your graphic has enough visuals is to add an icon representing each header.
Create visual examples of each key point in the infographic.
Infographics should be exciting and memorable, And images are great storytelling devices.
How to create an infographic?
Our step-by-step guide to creating an infographic is an excellent resource for designing an infographic.
No matter how excited you are to start creating your first infographic, it would help if you didn’t jump into the design process without a game plan.
Instead, start by creating an infographic outline.
Organize your information with an infographic outline:
You may better arrange your ideas and make sure that the material of your infographic will function by outlining.
Create an infographic templates outline from existing content using these four steps:
- Determine the key takeaway of your content
- Define titles, headings, subheadings, and information
- Consider paragraph and point length
- Include notes for the designer
This format will help the remainder of the design process go smoothly if you start with it.
For more details on running this process, see our guide to creating an infographic outline.
Choose an infographic template:
You are now prepared to choose an infographic template after you have an outline.
You can find the design ideas you need from pre-made infographic templates to get your infographic going. They can be helpful to even only as a starting point.
When selecting an infographic template, there are some factors to consider, including the color, font, length, size, and style of each design and how well each aspect fits with your material.
But most importantly, you need to pick the correct type of infographic template for your content.
Customize your infographic:
After selecting an infographic template, you can begin modifying it to suit your needs. This Leadership infographic can be adapted for other types of lists with the canvas editor.
Here are some examples of how to modify the infographics in this post:
- Change background and text colors
- Adjust the text to suit your message
- Add or swap icons relevant to your story
- Add your brand logo in the footer
- Increase or decrease the list size
Why should you buy this pack?
Infographics are excellent for making difficult-to-understand information easy to understand. You may find these helpful at any time:
- Unique infographic-style template for any business type and size.
- Editable using your brand colors, fonts, elements, and everything in between.
- Prepare a month’s worth of content in minutes.
- There’s no need to start from scratch.
- It is best for business owners, marketers, influencers, content creators, and writers.
When you need to give someone a quick rundown on something that might be difficult to explain in words alone, an infographic is a great way to go.
This means that infographics can be helpful in almost any industry. Here are some of its use cases (click to continue):
- Infographics for Marketing
- Infographics for consulting and freelancing
- Infographics for small businesses and entrepreneurs
- Infographics for Govt
- Infographics for Nonprofits
- Infographics for Education
Lifetime Deal of Leadership Infographics
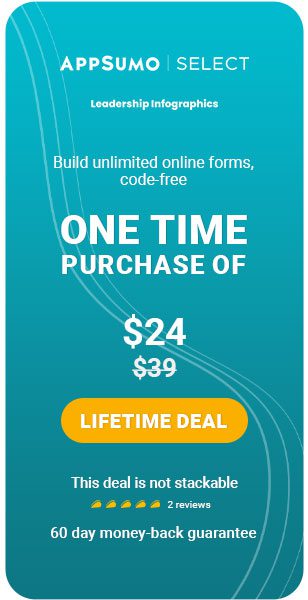
Appsumo offers a Leadership Infographics lifetime deal at just $24.
Conclusion
When struggling with your leadership, you can look at leadership infographics with Canva editable templates, quotes, and other attributes. Determine what you did wrong, what skills or qualities you could have used better, and imagine how you can do some things differently next time.
To continue to reflect on your behavior, resolve to practice, and grow in these leadership qualities. You will become a more effective leader who can take pride in your contribution to the lives of others.


0 Comments